
This version of DFT algorithm has been tested with success on a various microcontrollers (AVR – including ATtiny13, STM32 and ESP8266). The code is relatively simple and short what makes it easy to port to other programming languages / microcontrollers. In this tutorial I will open the black-box and show you some practical information about how this algorithm works and how to use it in your projects. I really recommend to make an experiments with different signal frequencies, sampling frequencies and number of N-points.
What You Need
To make it easier to understand and reproduce on your desktop I have created an example codes in Python. So, you need a computer and Python (version >= 2.7) with matplotlib package installed.
Generating Signal Samples
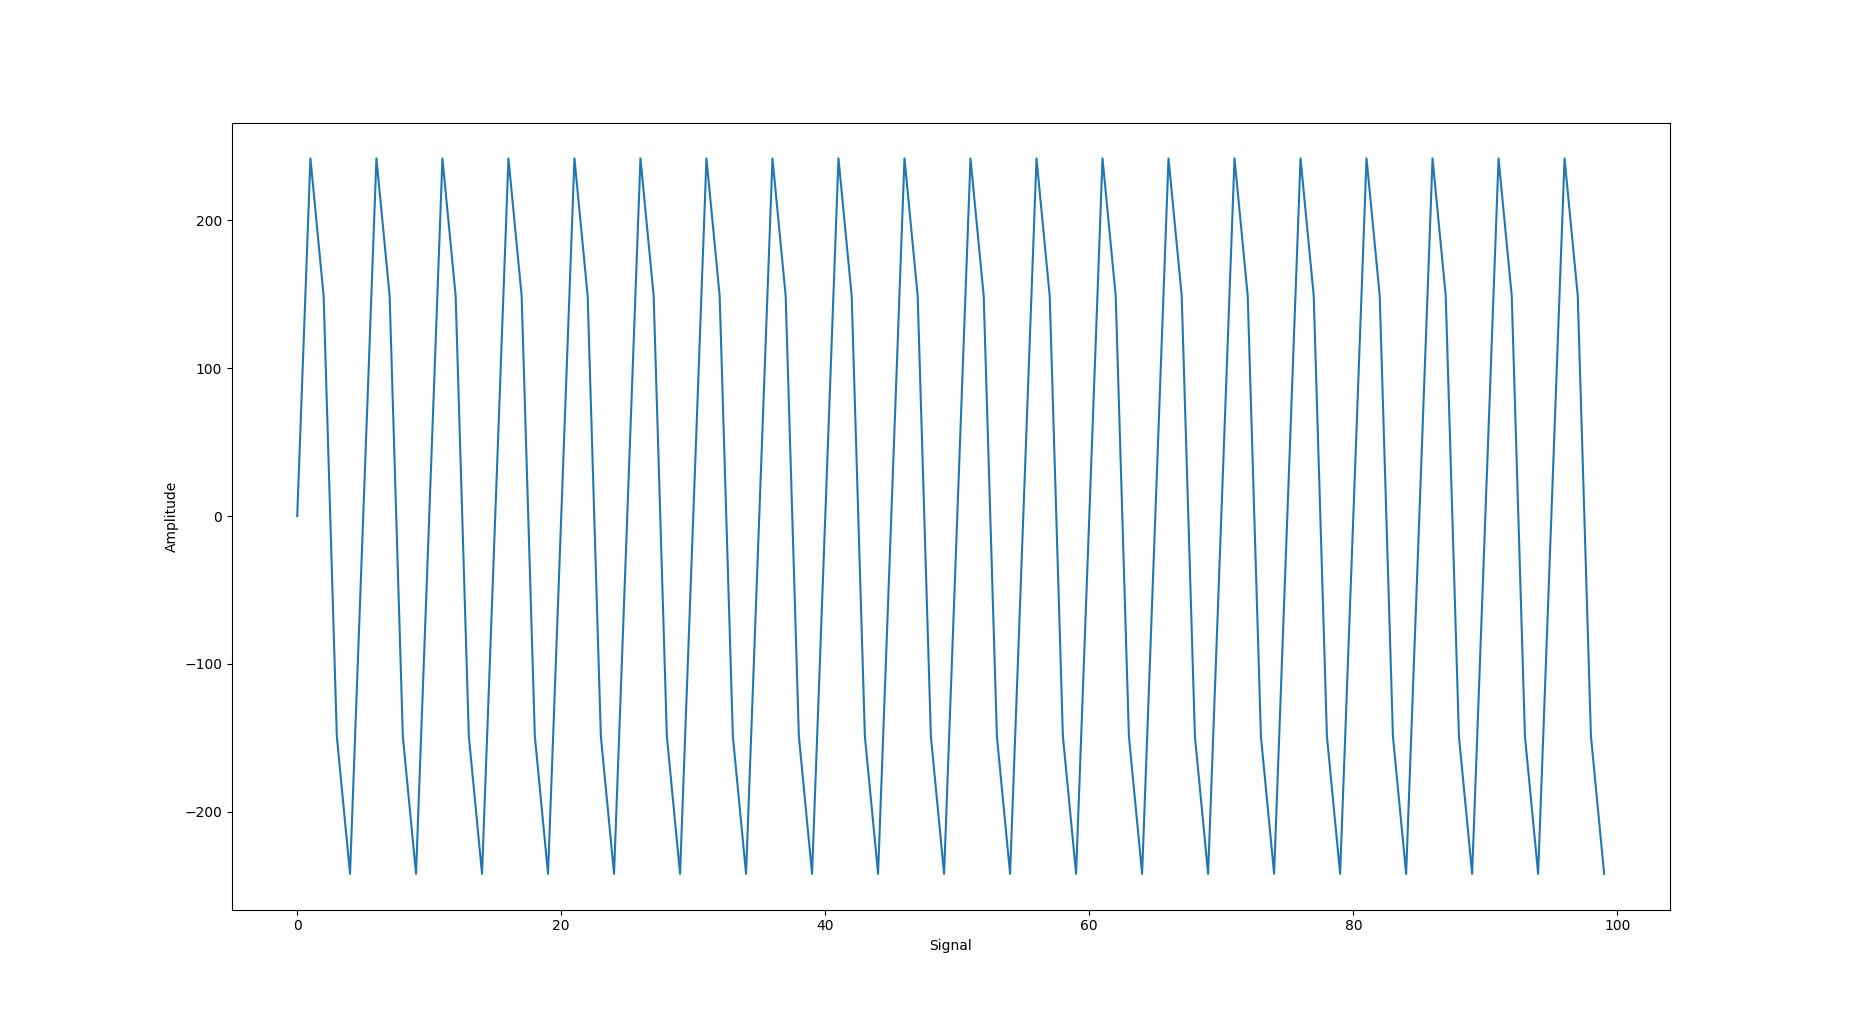
At first, we need to produce some example data. Bellow is the function that helps to generate a signal samples. You can pass signal frequency and sampling frequency as an argument.
#!/usr/bin/env python

import math
from matplotlib import pyplot

def signal(signal_frequency, sampling_frequency, volume=1.0, duration=1.0):
    samples = []
    samples_per_cycle = int(sampling_frequency/signal_frequency)
    samples_number = int(sampling_frequency * duration)
    for i in range(samples_number):
        sample = 255 * volume
        sample *= math.sin(math.pi * 2.0 * (i % samples_per_cycle) / samples_per_cycle)
        samples.append(int(sample))
    return samples

signal_frequency = 8000
sampling_frequency = 44100
duration = 100. / sampling_frequency
samples = signal(signal_frequency, sampling_frequency, 1.0, duration)

pyplot.plot(samples)
pyplot.ylabel('Amplitude')
pyplot.xlabel('Signal')
pyplot.show()
Computing Twiddle Factors
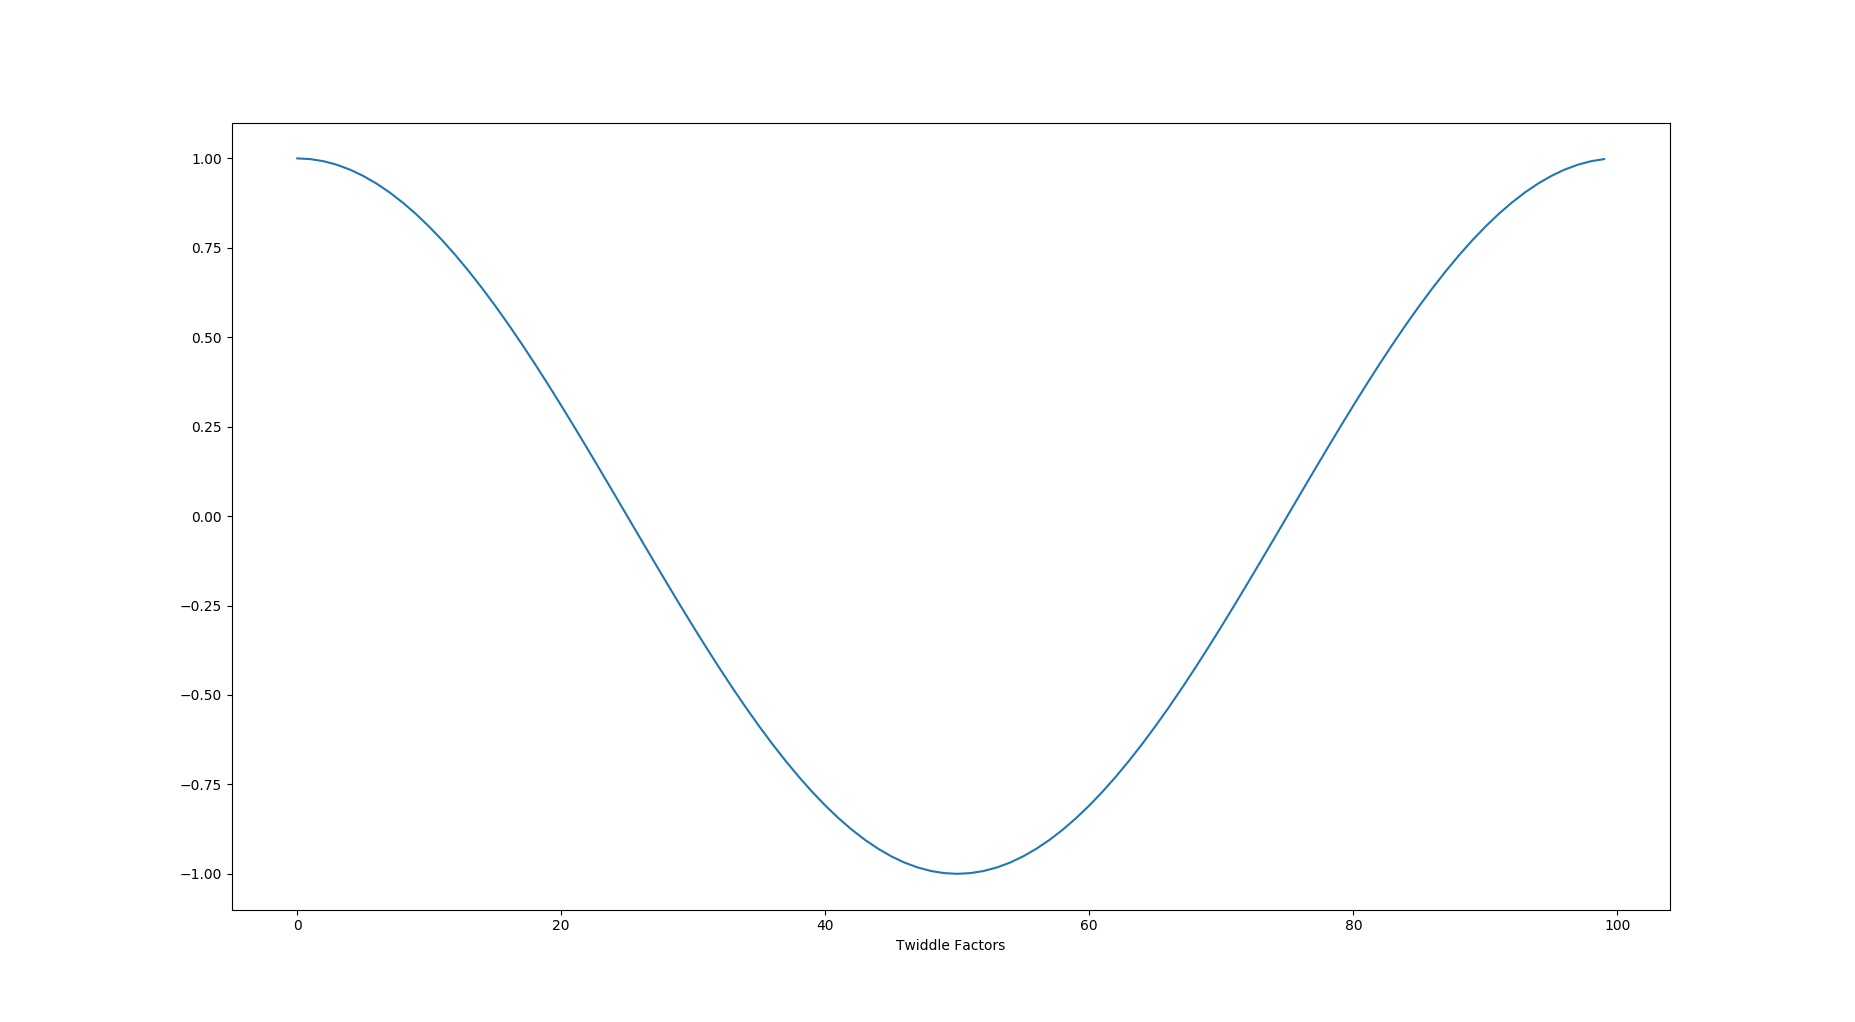
Bellow is an implementation of Euler’s Formula for Twiddle Factors.
#!/usr/bin/env python

import math
from matplotlib import pyplot

def twiddle_factors(N):
    return [math.cos(n*2*math.pi/N) for n in range(N)]

N = 100 # N-points
factors = twiddle_factors(N)

pyplot.plot(factors)
pyplot.xlabel('Twiddle Factors')
pyplot.show()
Optimized DFT Algorithm
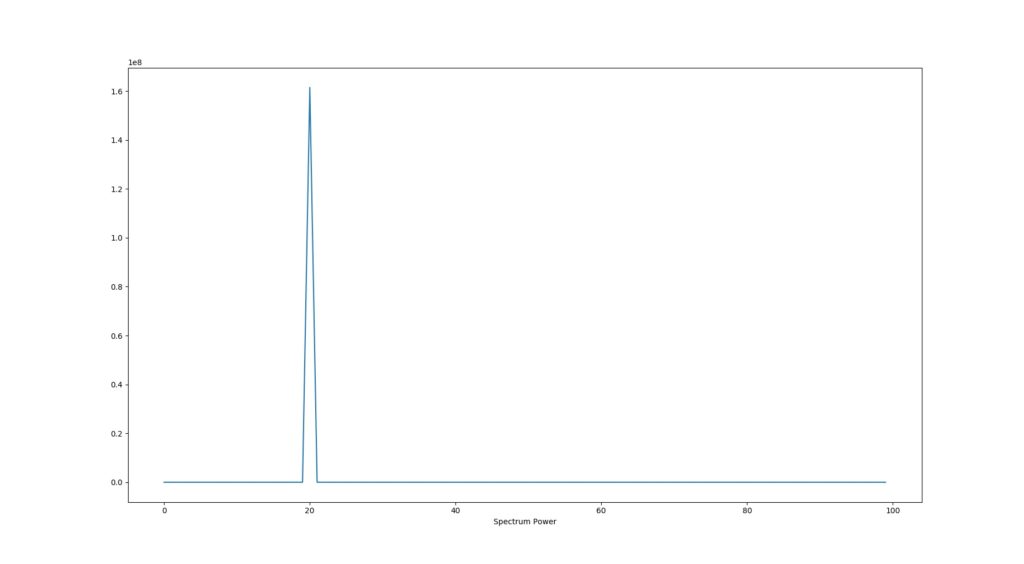
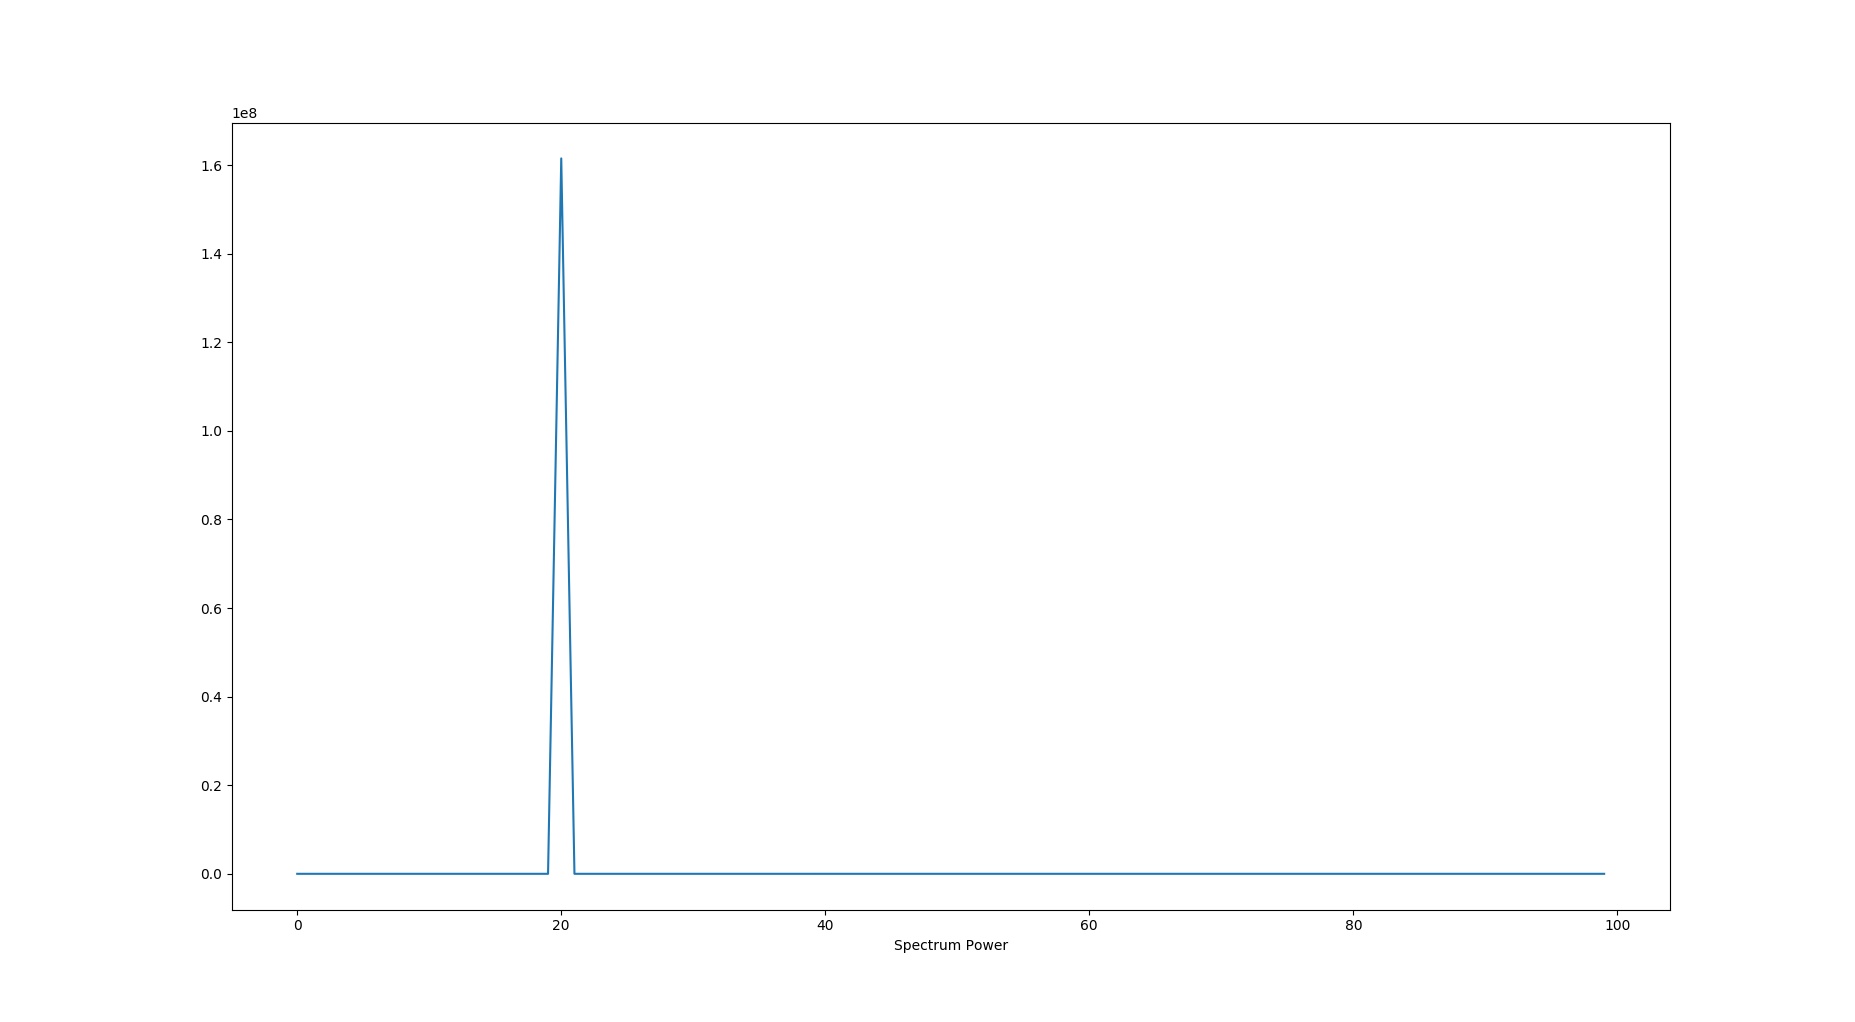
Finally, the DFT algorithm do samples processing. The output result is a power spectrum of the signal.
#!/usr/bin/env python

import math
from matplotlib import pyplot

def twiddle_factors(N):
    return [math.cos(n*2*math.pi/N) for n in range(N)]

def signal(signal_frequency, sampling_frequency, volume=1.0, duration=1.0):
    samples = []
    samples_per_cycle = int(sampling_frequency/signal_frequency)
    samples_number = int(sampling_frequency * duration)
    for i in range(samples_number):
        sample = 255 * volume
        sample *= math.sin(math.pi * 2.0 * (i % samples_per_cycle) / samples_per_cycle)
        samples.append(int(sample))
    return samples

def dft(samples, N):
    twiddle = twiddle_factors(N) # prepare factors for N-points
    offset = 3 * N / 4 # index offset for sin (const for N-points)
    re = [0.0] * N
    im = [0.0] * N
    power = [0.0] * N # power spectrum
    for k in range(N/2 + 1):
        a, b = 0, offset;
        for n in range(N):
            re[k] += samples[n] * twiddle[a % N]
            im[k] -= samples[n] * twiddle[b % N]
            a += k
            b += k
        power[k] = (re[k]*re[k] + im[k]*im[k]) / (N*N);
    return power

N = 100 # N-points
signal_frequency = 8000
sampling_frequency = 44100
duration = N * 1. / sampling_frequency
samples = signal(signal_frequency, sampling_frequency, 1.0, duration)
power_spectrum = dft(samples, N)

pyplot.plot(power_spectrum)
pyplot.xlabel('Power Spectrum')
pyplot.show()
Calculating Frequency Bands
for index in range(N/2):
     print("frequency(%d)=%d[Hz]" % (index, sampling_frequency * index/N))

...
[0] freqency=0[Hz], power=0
[1] freqency=441[Hz], power=0
[2] freqency=882[Hz], power=0
[3] freqency=1323[Hz], power=0
[4] freqency=1764[Hz], power=0
[5] freqency=2205[Hz], power=0
[6] freqency=2646[Hz], power=0
[7] freqency=3087[Hz], power=0
[8] freqency=3528[Hz], power=0
[9] freqency=3969[Hz], power=0
[10] freqency=4410[Hz], power=0
[11] freqency=4851[Hz], power=0
[12] freqency=5292[Hz], power=0
[13] freqency=5733[Hz], power=0
[14] freqency=6174[Hz], power=0
[15] freqency=6615[Hz], power=0
[16] freqency=7056[Hz], power=0
[17] freqency=7497[Hz], power=0
[18] freqency=7938[Hz], power=0
[19] freqency=8379[Hz], power=0
[20] freqency=8820[Hz], power=161529539
...
Finding Maximum Value In Power Spectrum
value = max(power_spectrum)
index = power_spectrum.index(value)
print("Maximum value=%d for frequency=%d" % (value, sampling_frequency * index/N))
...
Maximum value=161529539 for frequency=8820
...
Hi Łukasz Podkalicki.
I see the signal generated at 8Khz frequency. However, the FFT algorithm shows that this signal is 8.8Kz. Has there been a mistake here?
Thanks !
Hi! Thank you for this question. Yes, indeed. It happens because example function which generates signal is not so accurate (I’m using floor on real numbers). Anyway, good eyes! 🙂
/L